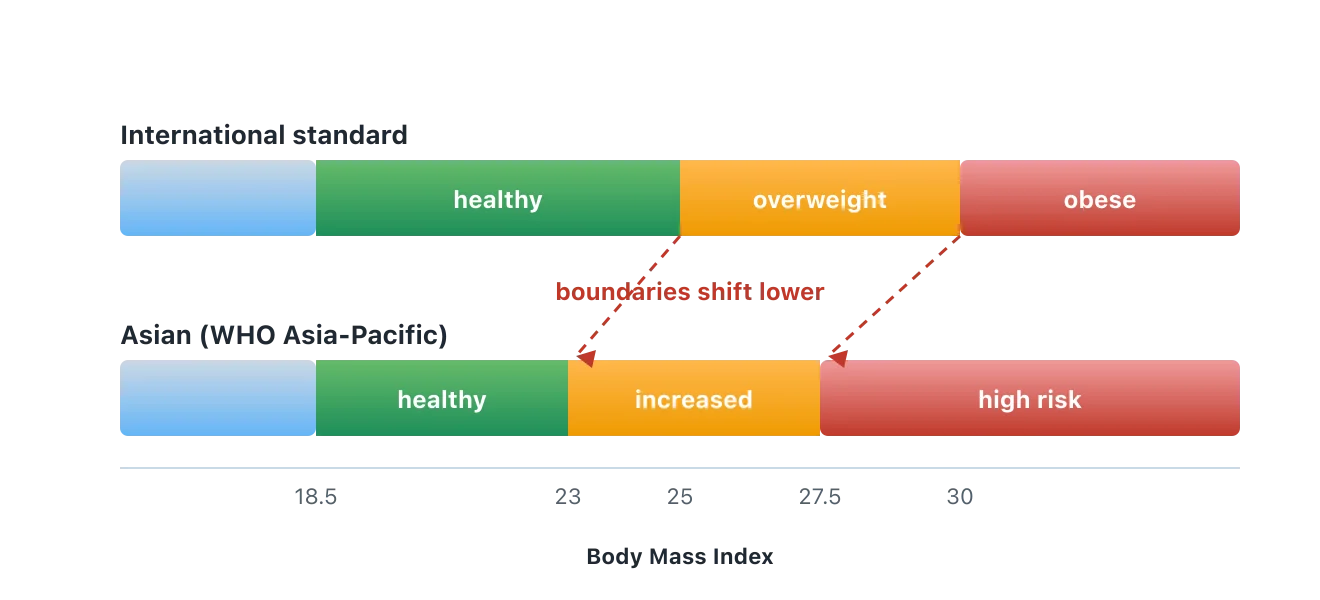
If you are of Asian descent, the standard BMI chart may be quietly misjudging your risk. Major health authorities, including the World Health Organization and Singapore's Health Promotion Board, treat a BMI of 23 as the point where risk starts to rise, rather than the familiar 25. The reason is not arbitrary. At the same BMI, several Asian populations tend to carry more body fat, and more of the deep abdominal fat that drives disease, so problems can appear earlier. Here is what that means for your own number.
On the Asian, or Asia-Pacific, standard, the healthy range runs up to a BMI of 22.9, increased risk begins at 23, and high risk begins at 27.5, compared with 25 and 30 on the international scale. Your BMI number does not change. Only the category it falls into does, because the cut-offs sit lower.
Why the thresholds are lower
The BMI formula treats every body the same way. It divides your weight by the square of your height and hands back a single number, with no adjustment for age, sex, or ancestry. That simplicity is part of why BMI spread so widely, but it also means the cut-offs that turn the number into a category were originally drawn largely from European and North American populations. When researchers looked more closely at other groups, they found that the same BMI did not always carry the same level of risk.
In many Asian populations, studies have shown that people tend to have a higher percentage of body fat, and more visceral fat around the organs, at a given BMI than white populations of the same number. Because it is that deep abdominal fat that drives insulin resistance and cardiovascular strain, a person of Asian descent can face the level of risk associated with being overweight while their BMI still reads as healthy on the international chart. The number understates what is actually happening inside the body.
The clearest example is type 2 diabetes. Large studies have found that the risk of diabetes rises at a lower BMI in South Asian, East Asian, and Southeast Asian groups than in white European groups, sometimes by several BMI points. Faced with this evidence, the World Health Organization convened an expert consultation that recommended keeping the standard international categories for global comparison, while adding lower additional trigger points for action in Asian populations. Those trigger points are what the Asian BMI scale describes, and they are meant to catch risk that the older lines would let slip through.
There is even a term for the pattern this creates: normal-weight obesity, where someone sits in the healthy BMI range yet carries a high proportion of body fat. It is more common in populations that store fat centrally at a lower weight, and it is precisely the situation a standard BMI chart is least equipped to catch. Lowering the cut-offs does not change anyone's body. It changes how early the same body triggers a second look, which is the entire purpose of a screening line. The aim is to notice a rising risk while it is still straightforward to influence, rather than after it has already become a diagnosis.
The WHO Asia-Pacific cut-offs
The Asia-Pacific thresholds shift the important lines downward while leaving the underlying number untouched. Where the international scale places the healthy range up to 24.9, the Asian standard closes it at 22.9. Where the international scale waits until 30 to flag high risk, the Asian standard raises that flag at 27.5. The table below sets the two side by side so you can see exactly where the lines move.
| Category | International BMI | Asian (Asia-Pacific) BMI |
|---|---|---|
| Underweight | below 18.5 | below 18.5 |
| Healthy | 18.5-24.9 | 18.5-22.9 |
| Increased risk (overweight) | 25-29.9 | 23-27.4 |
| High risk | 30 and above | 27.5 and above |
Singapore's Health Promotion Board adopted these lower thresholds officially, advising residents to aim for a BMI below 23 to keep risk low and treating 27.5 as the point of high risk. Several other health systems across the Asia-Pacific region use the same or very similar figures. The scale below shows the three Asian bands on a single strip, so you can see at a glance where 23 and 27.5 fall.
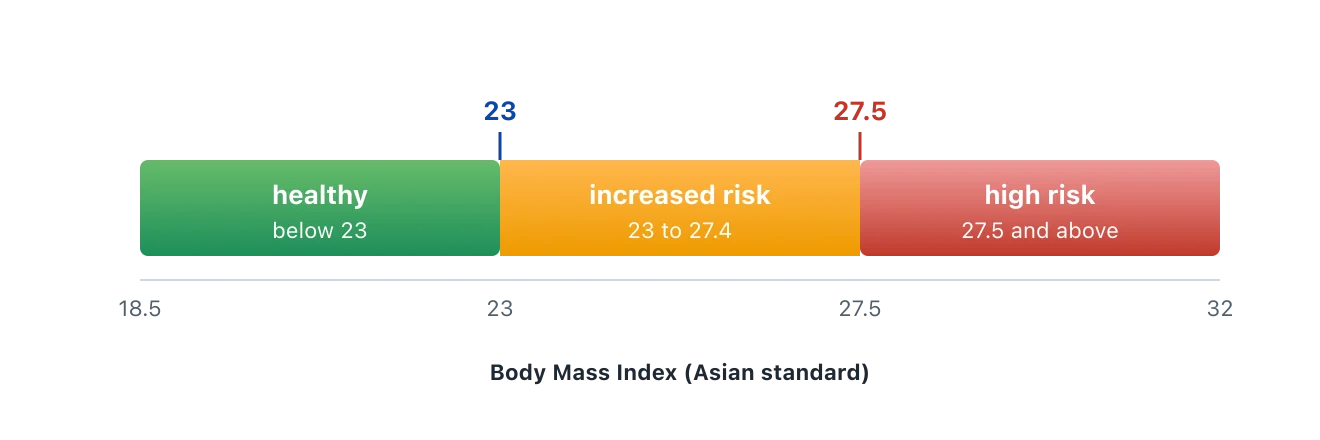
Notice that the Asian high-risk line, at 27.5, sits below the international high-risk line of 30. That is the whole point of the adjustment. It is not that Asian bodies are less healthy, but that the same warning signs show up at a lower number, so the screening threshold moves to meet them earlier and gives people a chance to act sooner. A lower line is a head start, not a harsher grade.
The waist cut-offs are lower too
BMI is not the only measure that gets a lower line for Asian populations. The same reasoning applies to waist circumference, the simplest direct gauge of central fat. For many groups, health bodies set the threshold for central obesity at a lower point, commonly around 90 centimetres for men and 80 centimetres for women of Asian descent, compared with the higher figures often quoted for European populations. Because central fat is the specific concern behind the whole adjustment, a lower waist cut-off follows naturally from the same body of evidence.
This is why waist-based measures pair so well with the Asian BMI standard. If your BMI lands near a boundary, a quick waist check, or better still your waist-to-height ratio, adds a second and independent read on the fat that matters most. When both point the same way, the signal is stronger and clearer than either gives alone. It is a small amount of extra effort, a tape measure and a moment, for a meaningfully fuller picture of where you actually stand.
Japan's JASSO scale
Japan uses its own national system, set by the Japan Society for the Study of Obesity, usually shortened to JASSO. Under this system, obesity begins at a BMI of 25, the same figure the international scale calls the start of overweight. In other words, what much of the world labels overweight, Japan classifies as the first degree of obesity, which reflects the same underlying finding that weight-related risk tends to arrive at a lower number in these populations.
The JASSO scale then divides obesity into degrees as the BMI climbs, with the higher degrees marking greater concern, and it identifies a separate category of high-degree obesity from a BMI of 35 upward. Japanese guidelines also lean heavily on visceral fat and waist measurement alongside BMI, reflecting a broader view that where fat sits matters as much as how much a person weighs. The exact figures differ from the WHO Asia-Pacific cut-offs, but the direction is the same, which is toward lower trigger points than the international default.
Who this applies to, and who it does not
The lower thresholds are guidance for people of Asian descent, and they are best thought of as earlier trigger points for a closer look rather than a different definition of disease. They were designed with South Asian, East Asian, and Southeast Asian populations in mind, and they are most relevant if your ancestry falls within those groups. If it does not, the standard international cut-offs of 25 and 30 remain the usual reference for you.
It is also worth being honest about the limits of any population-level adjustment. Ancestry is not a single, tidy category, risk varies within every group, and no chart can capture the whole of an individual. The Asian cut-offs are a sensible way to avoid systematically underestimating risk for large numbers of people, but they are still averages applied to individuals. That is exactly why they are framed as screening prompts, and why the right response to a category change is curiosity and a conversation, not alarm.
It also helps to know what the lower cut-offs are not saying. They are not a claim that people of Asian descent are inherently unhealthy, and they are not a separate definition of disease. They are a calibration, an acknowledgement that a single global line drawn decades ago from one set of populations does not fit everyone equally well. Read in that light, a category that shifts when you switch standards is not a judgement about you. It is the chart admitting its own limits and trying to serve you a little more accurately than a one-size-fits-all number ever could.
How to check your number against the Asian standard
Checking where you land is simple, because your BMI itself does not change between the two standards. The same height and weight produce the same number. All that differs is the category label that number receives. If you already know your BMI, you can compare it directly to the Asian bands in the table above: below 23 is the healthy zone, 23 up to 27.4 is the increased-risk band, and 27.5 or higher is the high-risk band.
Our BMI calculator makes this even easier, because it includes a standard selector. After you calculate your BMI, you can switch the standard from international to Asian, based on the WHO Asia-Pacific cut-offs, or to Japanese, based on the JASSO scale, and watch the category update while the number stays the same. Seeing the same figure move from one category to another is often the clearest way to understand what these lower thresholds really mean for you, rather than reading about them in the abstract.
Screening, not diagnosis
As with every version of BMI, the Asian standard is a screening tool and not a diagnosis. A BMI in a higher band does not by itself confirm any condition, and a BMI in the healthy band does not guarantee good health. The number is a prompt, a way of deciding whether a closer look is worthwhile, and it is most useful when combined with other simple measures such as your waist-to-height ratio, which captures the central fat that the Asian adjustment is largely concerned about in the first place.
If switching to the Asian standard moves you into a higher category, the sensible next step is not to worry but to talk it through with a qualified healthcare provider, who can weigh your blood pressure, blood sugar, cholesterol, family history, and lifestyle alongside the number. A lower threshold is meant to open that conversation earlier, when small changes are easiest to make, rather than to hand anyone a label. Used that way, the Asian BMI scale is a genuinely helpful piece of context rather than a cause for concern.