Your BMI is calculated the same way at 25 as it is at 75 - weight divided by height squared, no adjustment for the candles on your cake. But the body those two numbers describe is anything but constant. Across the adult decades you slowly trade muscle for fat, that fat migrates toward your middle, and eventually you even lose a little height. Each of those changes tugs at BMI, which means the same number can mean quite different things depending on how old you are. Understanding how BMI drifts with age is the key to not being misled by it.
One formula, every age
BMI was designed as a simple, universal screen, and its refusal to change with age is part of what makes it so easy to use. There is one catch: because the sum never adapts, all the adapting has to happen in your interpretation. A BMI of 24 in a lean 25-year-old and a BMI of 24 in a frailer 75-year-old are the same coordinate on the chart, but they can sit on top of very different amounts of muscle, fat, and bone. The formula treats them identically; a thoughtful reader should not.
What actually changes as you age
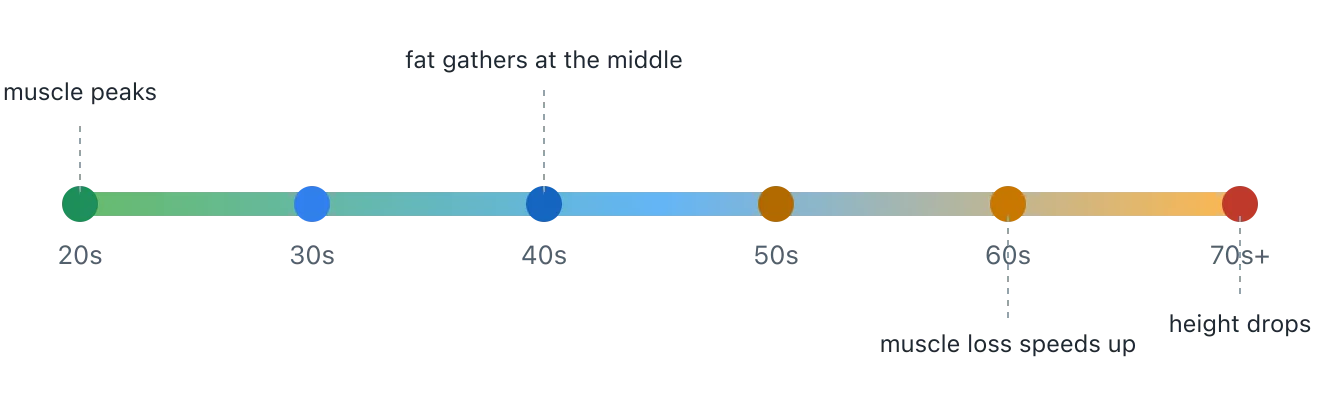
Three big shifts drive most of the story, and the timeline above sketches when they tend to arrive. First, muscle. Muscle mass is generally near its peak in your twenties and early thirties, then declines gradually unless you keep training it - a process called sarcopenia when it becomes pronounced in later life. Second, fat. Total body fat tends to creep up through midlife and, crucially, to redistribute toward the abdomen, where it is more metabolically active and more strongly linked to health risk. Third, height. From around the sixties onward, most people lose a little height as spinal discs compress and posture changes.
None of these are captured by BMI. It sees only the single number on the scale, so it registers the net effect on weight while staying blind to the far more important change in what that weight is made of.
It is worth stressing that these are population averages, not a schedule your own body is obliged to follow. Someone who lifts weights into their sixties can hold on to muscle that most people lose decades earlier; someone who becomes far more active in midlife can bend every one of these curves. The value of knowing the typical pattern is not to resign yourself to it, but to recognise which parts are worth actively resisting - muscle loss above all.
The muscle-fat shift
The slow swap of muscle for fat is the single most important age-related change BMI cannot see. Picture two lines over the decades: one for muscle, trending gently downward, and one for body fat, trending upward. Somewhere in midlife they cross.
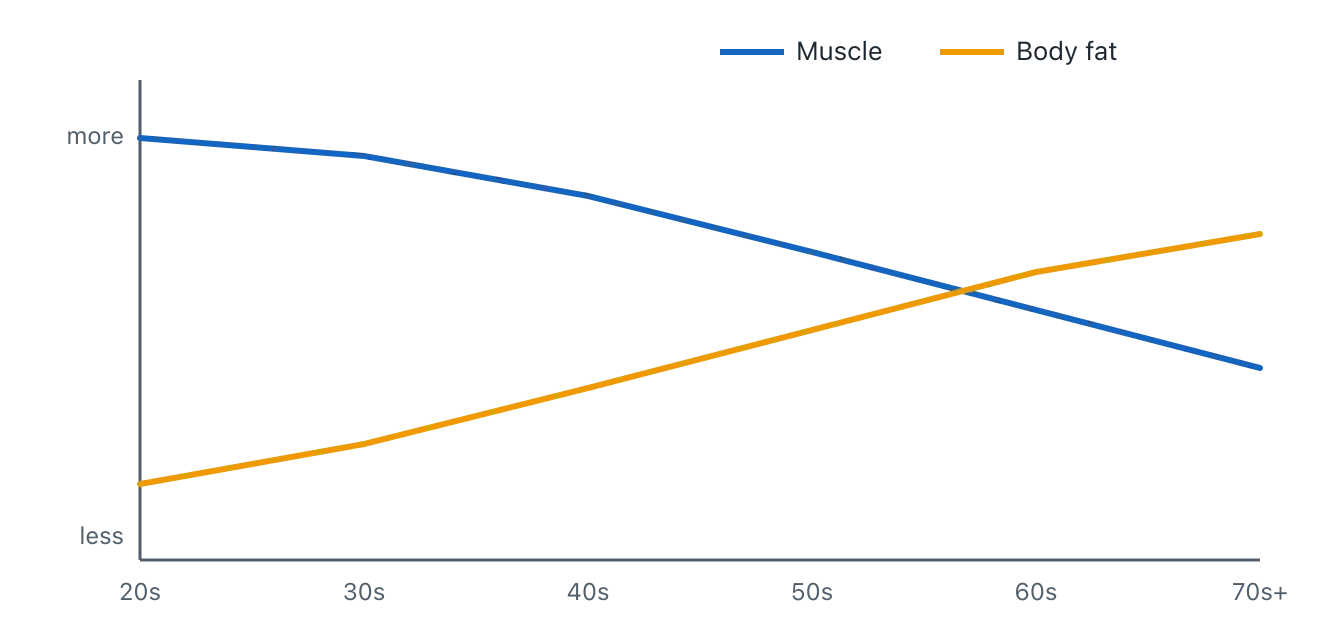
Here is why it matters so much: a person can keep exactly the same weight from 30 to 55, see an unchanged BMI, and yet be carrying noticeably more fat and less muscle at the end of that stretch. The scale - and BMI with it - reports "no change" while the health picture has genuinely shifted. This is the age-related version of the "skinny fat" pattern, and it is completely invisible to the weight-to-height ratio.
Shrinking height quietly inflates BMI
The height effect is subtle but real. Because BMI divides by height squared, a smaller height produces a bigger BMI for the same weight. If someone loses a couple of centimetres of height in older age but their weight is unchanged, their BMI ticks upward purely as an artefact of the maths. It can look like weight gain on paper when nothing about their body's fat or muscle has actually changed. It is a good reminder to re-measure height occasionally rather than assuming the figure from your thirties still holds.
Is a "healthy" BMI different later in life?
This is where the standard categories get genuinely contested. A growing body of research suggests that in older adults, a BMI slightly above the classic "healthy" band is not necessarily harmful and may even be associated with better outcomes - one idea is that a modest reserve of weight helps people weather illness, surgery, or a spell of poor appetite. At the same time, being underweight becomes a more serious concern in later life, because it can signal or accelerate muscle loss and frailty.
The honest takeaway is not a new magic number but a shift in emphasis: in older age, unintentional weight loss and loss of strength often deserve more attention than sitting a point or two above the healthy BMI range. As always, that is a conversation for a healthcare provider who knows the whole picture, not a rule to self-apply from a chart.
Children read BMI on a different system entirely
At the other end of the age range, BMI is not even compared to the same numbers. For anyone from age 2 to 19, a raw BMI is plotted as a percentile against thousands of others of the same age and sex, because a healthy range for a growing body changes month by month. A BMI of 19 could be perfectly healthy for one teenager and a flag for another of a different age. If you are checking a young person's BMI, use our child BMI calculator, which handles the percentile interpretation for you rather than forcing an adult category onto a growing body.
What to watch instead as you age
None of this makes BMI useless later in life - it remains a fine, quick screen - but it does mean you should read it alongside measures that age more gracefully. A waist measurement, compared to your height, tracks the fat that actually migrates with age. Strength and mobility - can you rise from a chair easily, carry the shopping, keep your balance - often say more about healthy ageing than any weight number. And a sudden, unplanned change in weight in either direction is worth flagging promptly.
So calculate your BMI, by all means, and watch its trend. Then add your waist-to-height ratio and an honest sense of your strength and energy, and take anything that surprises you to a professional. Read that way, BMI ages well: not as a verdict that pretends your body is the same at 70 as it was at 25, but as one modest signal in a fuller, more human picture of health.
One last habit makes all of this easier: track the trend, not the single reading. A BMI that has sat quietly at 26 for fifteen years tells a very different story from one that has climbed from 22 to 26 in three, even though today's number is identical. Because the body's composition drifts slowly, the direction and speed of change carry more meaning than any one measurement - which is exactly what a private history, kept over the years, is good at revealing.