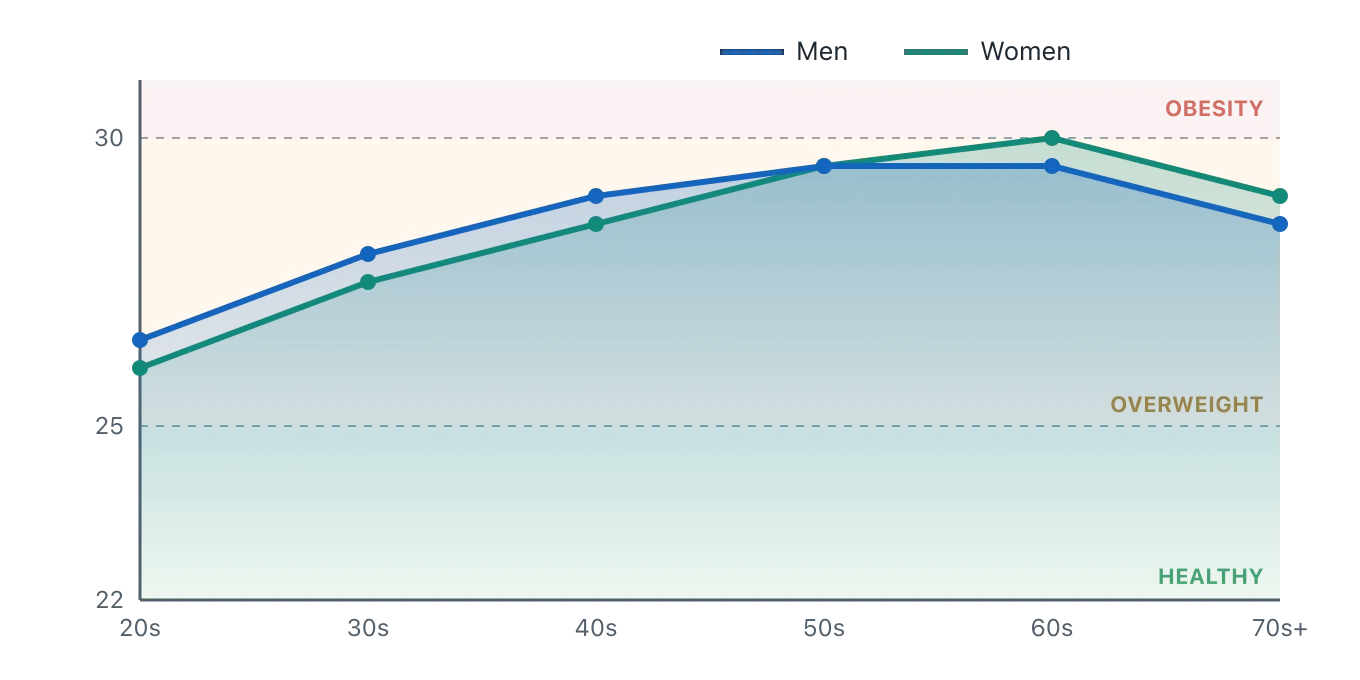
We love to measure ourselves against "average." Average height, average salary, average screen time - and, more than almost anything health-related, the average BMI. It is one of the most-searched body numbers on the internet. But the average BMI carries a trap hidden inside it: in much of the world, the average adult is no longer in the healthy range, which means "typical" and "healthy" have quietly parted ways. Here is what average BMI actually looks like across ages and between men and women, and why the number is a description of a crowd rather than a goal for a person.
In many countries the average adult BMI now sits in the overweight band. It tends to rise from the twenties into midlife, then level off or dip in older age, and men and women track fairly closely. None of that makes the average a target to aim for.
What "average" BMI actually means
An average is simply the middle of a pile of numbers. When a national survey - like the CDC's NHANES programme in the United States, or comparable studies elsewhere - measures the height and weight of thousands of people, it can report the mean BMI of the whole group. That single figure is genuinely useful for spotting trends over time and comparing countries. What it cannot do is tell any individual what they "should" weigh.
The healthy BMI range on the international scale is about 18.5 to 24.9. The average adult BMI in many high-income countries has drifted up over the past few decades and now lands in the mid-to-high 20s - which is inside the overweight band, not the healthy one. That is the crucial disconnect: it is entirely possible for a whole population to be, on average, above the range associated with the lowest risk. When that happens, chasing "average" would mean chasing a number the health guidelines themselves flag as elevated.
Average BMI by age
The chart above shows the pattern that appears again and again in national data. Average BMI is lowest in early adulthood, climbs steadily through the thirties and forties, and reaches its peak somewhere around the fifties and sixties. After that it tends to flatten and, in the oldest age groups, edge back down.
Several things drive the climb. As people move through their careers and raise families, day-to-day activity often falls while portion sizes and eating-out do not. At the same time, the body slowly trades calorie-hungry muscle for fat unless that muscle is actively maintained - so weight can creep up even when the scale moves slowly. The later-life dip has less cheerful explanations: illness, appetite changes, and muscle loss can all pull weight down, and the people who reach the oldest age brackets are not a random sample of everyone who was once middle-aged. In other words, the curve bends for reasons that have nothing to do with any single person's "ideal" weight.
One important boundary: these averages are for adults only. For children and teenagers, BMI is never compared against a fixed number like 25 or 30 - it is plotted as an age- and sex-specific percentile, because a growing body's healthy range shifts month by month. An "average BMI by age" curve for adults therefore says nothing about whether a 12-year-old's reading is where it should be; that is a separate measurement with its own charts, handled by our child BMI calculator. Keep that in mind whenever you see BMI and age plotted together.
Average BMI by gender
Look at the two lines and you will notice something surprising: the average BMI for men and for women is usually quite close. If BMI were a perfect measure of body fat, you might expect a bigger gap. It stays narrow because BMI is blind to what a body is actually made of.
At the same BMI, a typical woman carries a higher proportion of body fat than a typical man, because women have more essential fat for hormonal and reproductive health, while men tend to carry more muscle. So two people - one man, one woman - can share an identical BMI and an identical spot on this chart while having genuinely different bodies underneath. This is one of the clearest reminders that BMI is a screening ratio of weight to height, not a body-composition scan. It is why a fuller picture usually pairs BMI with something that senses fat distribution, such as a waist measurement.
How adults spread across the categories
Averages hide the shape of a population. Two countries could share the same mean BMI while one has mostly middle-of-the-road readings and the other has large groups at both extremes. So it helps to look at how adults spread across the BMI categories rather than at the average alone.
Roughly how adults fall across BMI categories

Illustrative figures for adults in the United States; a small share (about 2%) sit in the underweight range. Exact numbers vary by survey year and country.
Charts like this explain why so many people are told their BMI is "above the healthy range" - in many places, most adults now are. That does not make it harmless or normal in the medical sense; it simply means the average has moved, while the health line has stayed roughly where the evidence puts it.
Why the average is not a target
Here is the mistake worth avoiding: seeing that the average BMI is, say, 29, and quietly deciding that 29 must therefore be "fine for someone like me." Averages describe what is common, and common is not the same as healthy. If a whole neighbourhood rarely slept enough, the average sleep would fall - but you would not conclude that five hours a night is the right goal.
A far more useful reference than the population average is your own healthy weight range for your height, which you can read straight off the BMI chart. Even that range is a screening guide rather than a bullseye. The things that most reliably move health - regular movement, decent sleep, mostly whole foods, and not smoking - do not require hitting any specific number on the scale at all. If you are setting goals, anchor them to habits you can keep, and bring the specifics to a healthcare provider rather than to a national average.
What the averages can't tell you about you
Population averages are powerful for public health and almost useless for personal decisions, because every reason to distrust BMI for an individual is invisible in a mean. The average cannot see the weekend lifter whose muscle inflates his BMI, the older adult whose "healthy" BMI hides lost muscle, or the fact that some populations of South and East Asian descent face higher risk at a lower BMI, which is why several health authorities use lower cut-offs for them.
So treat the average as context, not a verdict. If you want a number that means something for you, start with your own BMI, then add a measure that senses where fat sits, like your waist-to-height ratio, and read both as screening prompts for a conversation with a professional. That combination will always tell you more than knowing whether you are a little above or below the crowd.